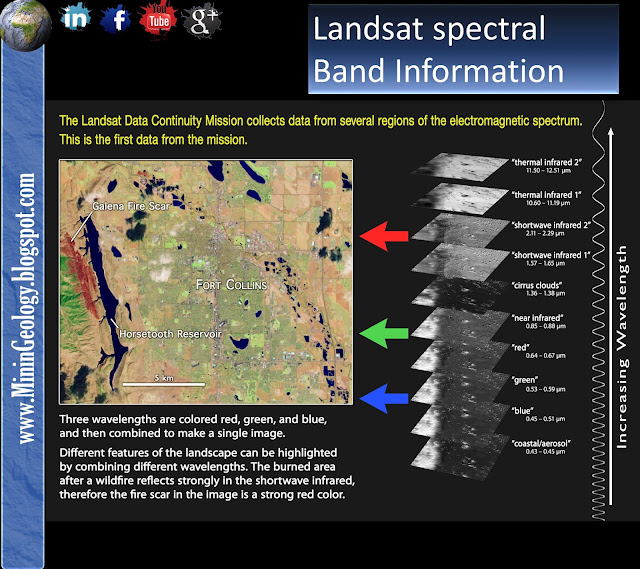
Landsat spectral Band Information
Band
1 – blue (0.45-0.52) This
short wavelength of light penetrates better than the other bands, and it is often the band of choice for monitoring aquatic ecosystems (mapping
sediment in water, coral reef habitats, etc.). Unfortunately
this is the "noisiest" of the Landsat bands since it is most susceptible
to atmospheric scatter.
Band 2
GREEN (0.52-0.60)
This has similar
qualities to band 1 but not as extreme. The band was selected because it matches
the wavelength for the green we see when looking at vegetation.
Band 3
red (0.63-0.69)
Since
vegetation absorbs nearly all red light (it is sometimes called the chlorophyll
absorption band) this band can be useful for distinguishing between vegetation
and soil and in monitoring vegetation health.
Band4
near infrared (0.76-0.90)
Since
water absorbs nearly all light at this wavelength water bodies appear very
dark. This contrasts with bright reflectance for soil and vegetation so it is a
good band for defining the water/land interface.
Band
5
Short-wave Infrared (1.55-1 .75)
This
band is very sensitive to moisture and is therefore used to monitor vegetation
and soil moisture. It is also good at differentiating between clouds and snow.
Band
6
thermal
infrared (10.40-12.50)
This
is a thermal band, which means it can be used to measure surface temperature. Band
6 is primarily used for geological applications but it is sometime used to
measure plant heat stress. This is also used to differentiate clouds from
bright soils as clouds tend to be very cold. The resolution of band 6 (60m) is half
of the other bands.
Band
7
mid-infrared
(2.08-2.35)
This
band is also used for Hydrothermally altered rocks associated with mineral
deposits, as well as for soil and geology mapping.
Band
8
Panchromatic
15
meter resolution, sharper image definition. Used for spatial resolution ENHANCEMENT


0 التعليقات:
Post a Comment