Monday, July 27, 2015

Extraction of land-surface parameters and objects from DEMs

Extraction of land-surface parameters and objects from DEMs


Edited by TOMISLAV HENGL Institute for Biodiversity and Ecosystem Dynamics University of Amsterdam Amsterdam, The Netherlands .

HANNES I. REUTER Institute for Environment and Sustainability DG Joint Research Centre Land Management and Natural Hazards Unit – European Commission Ispra, Italy
Share:

Saturday, July 25, 2015

petrified wood ...

Petrified wood found only in a specific area of Utah...it's called -yellow cat
Petrified Wood Specimen (petrified Conifer wood slab)  Arizona


petrified wood ... Zimbabwe


Share:

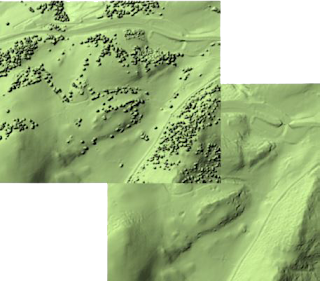
Extracting some Geomorphological features from Aerial photograph Vs LIDAR DTM

"The effectiveness of high-resolution topography (0.5 m DTM) derived by LIDAR data in the recognition of geomorphological features in the mountainous landscapes (slides courtesy of Paolo Tarolli)".


About Author 


These are slides of a well known presentation he gave in several conferences, seminars, and lectures since 2006. 


Share:

Friday, July 24, 2015

Determine your imagery to use!!!


After you clearly understood the problem that needs to be solved, you need to determine or choose the right imagery to be obtained for extracting the information we need. There a large number of data types are available to suit various needs.
As Examples
1. If we are studying thrust belts, we may wish to order 1:1,000,000 B/W single-band Landsat multispectral scanner (MSS) images with 80 m resolution and large area coverage (185 × 185 km) to make a mosaic of part of a continent.
2. If we are doing a basin analysis, then a color MSS image at 1:250,000 or 1:500,000 should be acceptable.
3. If we are mapping details of lithologic and facies changes, or vegetation patterns and wildlife habitats, we can use color SPOT multispectral (XS) imagery with 20 m resolution and 60 × 60 km (vertical view) coverage at a scale of 1:100,000 or 1:50,000, or Color Landsat Thematic Mapper (TM) imagery, with 30 m resolution, and covering 185 × 185 km at a scale of 1:100,000 would also work.
4. For mapping alteration associated with mineral deposits, the ideal choice is high resolution (1–10 m) airborne hyperspectral imagery. If that is not available or is too expensive and the area is large and remote, we may wish to use Landsat TM for a reconnaissance look.
5. If we want to know where a well was drilled several years ago in a poorly mapped part of the world, we chose a SPOTP high resolution (10 m) panchromatic image or 5 m resolution.
6. For very fine detail, GeoEye or WorldView images have approximately > 1 m resolution. These can be enlarged to > 1:25,000 and still appear clear and sharp.
The following factors should be taken into account when ordering data (Dekker, 1993).

1. Cost
One factor to keep in mind is that the smaller the area covered, the higher the cost per unit area. Airphotos or airborne imagery will almost always cost more per unit area than satellite images.

2. Timing
If the imagery is needed immediately, one can screen grab free but rather low-quality imagery from internet sources such as Google Earth or purchase off-the-shelf data from a government agency or vendor. Large image archives exist, and data can often be obtained quickly. Purchasing custom images from vendors and consultants, or processing digital data in your own shop can take up to several weeks.

3. Coverage
A- Large area coverage can be obtained using weather satellites such as GOES (covers a full hemisphere), the Advanced Very High Resolution Radiometer, which covers a 2700 km swath on the Earth’s surface, or the SeaWIFS instrument, with a 1502–2801 km swath width.
B- Moderate size areas can be covered using some handheld Shuttle (and other mission) photos (variable area coverage), as well as Landsat images (MSS and TM), which cover 185 × 185 km. Systems that cover 50 × 50 to 500 × 500 km include MK-4 photos (120–270 km), KATE-200 photos (180 × 180 km), KFA-1000 photos (68–85 km), and the SPOT systems (XS and P) that cover 60 × 60 km.
Satellite images generally cover larger areas than airborne photos or images, and the synoptic view is one of their greatest advantages.
C- For field or local studies, airborne surveys or small area satellite images will save cost and/or provide more detail. Recent satellites, such as Worldview 2, 3 and GeoEye-1, have very high resolution (up to 31 cm for the panchromatic sensor and 1.65 m for the multispectral instrument) and cover correspondingly smaller areas (16.4 and 15.2 km swaths, respectively).

4. Resolution
The scale of the final image will to some extent be a function of the sensor system resolution, in that one cannot enlarge, say, an image with 80 m resolution to a scale of 1:100,000 without the image becoming “pixelated,” that is, breaking up into the individual resolution elements that appear as an array of colored squares.

5. Nighttime Surveys
Thermal and radar surveys can be flown effectively at night because neither system relies on reflected sunlight: the radar instrument illuminates the surface by providing its own energy source, and thermal energy is radiated from the surface.
Predawn thermal imagery reveals, among other things, lithologic contrasts related to differing rock and soil densities or color tones (light versus dark). Nighttime thermal imagery can reveal shallow groundwater and moist soil (generally warmer than background), can detect oil spills on water, and can help map underground coal mine fires. Because radar illuminates the ground with microwaves, it can be flown at night to map oil spills, for example, or during polar night to map the movement of ice floes that could threaten an offshore oil rig or platform.

6. Seasonal/Repetitive Coverage
Certain seasons are better for specific surveys. For example, a geologic mapping project in an area covered by temperate forest would see more of the ground in spring before deciduous plant leaf-out or in the fall, after leaves have dropped.
High sun elevation angle (summer) provides images with the best color saturation, which can be useful when mapping lithologies in low contrast areas. On the other hand, low sun angle images (flown during the morning or in winter), especially with a light snow cover, enhance geologic features in low-relief terrain.
If repetitive coverage is needed to monitor natural (e.g., flooding, ice floes) or man-made (e.g., drilling, roads) changes, it is often most cost effective to use satellites because of their regular repeat cycles. Repeated aircraft surveys provide more detail but are much more costly.

7. Relief
Low-relief terrain may require low sun angle or grazing radar imagery to enhance subtle topographic and structural features.
On the other hand, high-relief terrain poses the potential problem of large shadowed areas that can obscure important areas or details. These areas should be flown during mid-day or using radar with a steep depression angle to minimize shadows. 

8. Vegetation Cover
Color infrared images are very sensitive to changes in vegetation type or vigor, since the peak reflection for vegetation is in the near infrared region. Combinations of infrared and visible wavelengths have been used to map changes in vegetation related to underlying rock types and even hydrocarbon seepage (Abrams et al., 1984).
Lidar which will also provide an image of the top of the vegetation canopy that looks like topography. There are some image processing methods, called “vegetation suppression” techniques, which appear to remove vegetation and reveal subtle changes in the underlying soil or bedrock. These algorithms tend to remove the reflectance attributed to vegetation and enhance the remaining wavelengths.

9. Water-Covered Areas
Shorter wavelengths (blue and green light) penetrate water farther than longer wavelengths. The euphotic or light-penetrating zone is known to extend to 30 m in clear water (Purser, 1973).
Infrared light, which has longer wavelengths than visible light, is absorbed by water and does not provide information on bottom features.

Landsat TM, with its blue band, is excellent for mapping shallow water features such as shoals, reefs, or geologic structures. Likewise, true color and special water penetration films such as Kodak Aerocolor SO-224 have excellent water penetration capabilities (Reeves et al., 1975). Side-scan sonar is available for shallow and deep water mapping, and produces images of the sea bottom reflectance using acoustic energy, much like radar uses microwave energy to produce an image.

References
Abrams, M.J., J.E. Conel, H.R. Lang. 1984. The Joint NASA/Geosat Test Case Project Sections 11 and 12. Tulsa: AAPG Bookstore.
Dekker, F. 1993. What is the right remote sensing tool for oil exploration? Earth Obs. Mag. 2: 28–35.
Junge, C.E. 1963. Air Chemistry and Radioactivity. New York: Academic Press: 382 p.
Purser, B.H. 1973. The Persian Gulf. New York: Springer-Verlag: 1–9.
Reeves, R.G., A. Anson, D. Landen. 1975. Manual of Remote Sensing, 1st ed, Chap. 6. Falls Church: American Society of Photogrammetry.
U.S. Bureau of Land Management. 1983. Aerial Photography Specifications. Denver: U.S. Government Printing Office: 15 p.
Share:

Tuesday, July 21, 2015

Moroccan Ammonite


Moroccan Ammonite with a calcite replacement of its cellular structure and inlaid sections of synthetic Opal
Share:

“Halley’s Comet” Opal


The 2000 carat “Halley’s Comet” Opal - Listed in the Guinness Book of World Records as the largest uncut Black Opal nodule. Found at Lightning Ridge, Australia in 1986
Share:

Phantom Quartz


Share:

Monday, July 20, 2015

Amazing Flourite

12 Fluorita rainbow - South Africa

Share:

Tiffany Opal Necklace with Demantoid Garnet Accents


Tiffany Opal Necklace with Demantoid Garnet Accents, Janet Annenberg Hooker Hall of Geology, Gems, and Minerals This necklace by Louis Comfort Tiffany sports a black opal from Australia’s Lightning Ridge, along with demantoid garnet accents from Russia.
Share:

Twin Galaxy Stones

11 Black Opal 

Twin Galaxy Stones - A stunning pair of nearly identical Lightning Ridge Black Opals. These rare stone are both more valuable than diamonds.


Source Here
Share:

Saturday, July 18, 2015

Amazing Boulder Opal

10 Boulder Opal - Jundah, Queensland, Australia

Share:

The stone of spiritual enlightenment

09 Seraphinite
 Seraphinite is a stone of spiritual enlightenment said to be among the most important stones discovered for connecting and communicating with higher energies. It facilitates conscious awareness on many higher planes, is excellent for accessing self-healing, promotes living from the heart. It cleanses the aura, strengthens, activates and balances all chakras. Causes old patterns of disease or imbalance to fall away, thus creating space for new patterns of well-being to form.

Source http://site.douban.com/186615/widget/photos/12712750/photo/1944252314/
Share:

Friday, July 17, 2015

Scheherazade's Palace ring

03 Gold and silver Scheherazade's Palace ring featuring diamonds, mosaic with turquoise tesserae and a blue tourmaline with an inversely engraved intaglio.

By Rachel Garrahan in New York

Scheherazade, the legendary Persian queen, was famed for her storytelling prowess. Enthralling the murderous King Shahryar with tales of courage, mischief and romance over 1,001 nights, she avoided death at his hands and captured his heart in the process. These stories form the basis of the book The Arabian Nights, which has charmed readers around the world for centuries.

Leave it to Sevan Biçakçi, a master of storytelling in jewellery form, to recreate the Persian queen's palace in a ring. Featuring two of the Turkish master-jeweller's signature techniques - intaglio carving and micro-mosaic - the queen's palace rises majestically beneath blue tourmaline, its domes echoed in the dramatic setting of turquoise tesserae, diamonds, blackened silver and gold.

Describing his jewellery as "Byzantine empire meets Alice in Wonderland", Sevan Biçakçi is famously secretive about the techniques used to create his fantastical pieces. (Not even Maria,The Jewellery Editor, was allowed to film Sevan's workshop during her visit to Istanbul.) Drawing heavily on the historical and cultural influences of his native Turkey, his work is unlike anything you might see in a museum - or contemporary jewellery boutique for that matter.

Instead you are left to wonder at the miniature marvels contained below the extraordinary domes of his unique pieces. Inspired by the impressive dome of Istanbul's Hagia Sophia, built in 537AD, the cupola and outlying architecture of this historic monument has been sheltered for eternity beneath a smoky topaz, beautifully contrasted with large rose-cut and fancy colour diamonds set luxuriously around the shank.

Nature is another recurring source of inspiration for Biçakçi, brought to life in his ladybird ring - creatures he describes as good-luck bugs - that appear to scurry beneath an inversely carved smoky topaz. These scarlet creatures are richly matched with the turquoise of the micro-mosaic leaf that wraps itself around the finger.

For those who prefer the escapism of a bright blue sky, his one-of-a-kind aquamarine ring depicts doves -  symbols of peace and freedom - in flight against a dazzling backdrop of 3.76 carats of diamonds; yet another mesmerizing option  from the enchanted Byzantine world of Biçakçi, for the woman who wants to tell a unique story on her finger.

Sevan's work is available in many stores across the world including the Grand Bazaar and Zorlu Center in Istanbul, Harvey Nichols and Talisman Gallery in London, Strasburgo in Tokyo, and Barneys New York stores across the US.
Share:

Dendritic agate

07 Dendritic agate 26,20 ct


Beautiful sagenitic agate pear cabochon. B. Chatenet's ex-collection.

Weight : 26,20 ct
Size : 28,0 x 28,0 x 6,2 mm
Clarity : Opaque
Shape : Cabochon
Color : Grey, black
Provenance : Turkey
Treatment : None
Share:

8-Black Opal

08Largest Freeform Black Opal In The World


1200 gr or 6000 ct Largest Freeform Black Opal In The World. #-COL0017 P.O.A.

The huge carving weights 1.2 Kg or 6,000 carats, making it the largest freeform black opal in the world.The carving is 12" long 9" wide and 3" thick at the top tapering down to 1" thickness at the bottom. The color bars go right through and out the back of the piece.

Share:


02 Beautiful Gem Rings

Share:

Thursday, July 16, 2015

Beautiful Rings From Opal

01 Opal and Gold ring
02 Opal and Diamond ring

Share:

Amazing Opal

06 This is an American Contra Luz Opal.

Share:

Wednesday, July 15, 2015

Amazing Koroit Opal

05 Koroit Opal
Koroit Opal

Koroit Opal

Share:

Tuesday, July 14, 2015

Koroit Opal Nuts - Australia

04 Koroit Opal Nuts – Australia


Share:

Saturday, July 11, 2015

Remote Sensing for Geoscientist

Our Problem Vs Our Image!!!


All remote sensing projects begin with a problem we are trying to solve: We may want to find out where the oil is,
where to drill, the best way to get to a drill site, and where to build a pipeline or a gas plant for the least cost and with minimal environmental disruption. We may wish to lay out a seismic program most efficiently or find out where a competitor has shot a seismic program. We require a source of water for drilling, for a coal slurry pipeline, or for keeping dust down in a mining operation. If we are involved with mineral exploration, we will be looking for any evidence of mineralization in a new mineral province, or which direction to extend a known deposit. We need to know the state of the terrain before mining so that we know how to restore it to its pre-mining condition. Was there natural acid drainage before mining or is it coming from the tailings ponds?


In order to determine the best imagery to evaluate, we must know what we are looking for. Is the area large or small? Does our problem require us to see fine details (centimeters up to 10 m resolution), moderate detail (20–100 m resolution), or regional features (100 m to 1 km resolution or more)? What scale do we wish to work with? Do we need to detect color changes (e.g., lithology, alteration) or vegetation stress? Is the area always under clouds? Is the area in a polar region that has an extended dark season? Are we looking for changes in moisture conditions? Is the area under water? Do we require or want a certain date or specific time of year? Do we need multitemporal (repetitive) coverage or historical coverage? Finally, how much time do we have and what kind of budget do we have to work with? Should we go to a vendor, the government, or process the data ourselves? The answers to these questions will determine the products that are acquired and the types of analyses that are possible.
Share:

Friday, July 10, 2015

Tripiche Emerald

Tripiche Emerald - Coscuez, La Peña Blancas, Muzo Mining District, Colombia

Share:

Make your rocks look beautiful

Make your rocks look beautiful


Share:

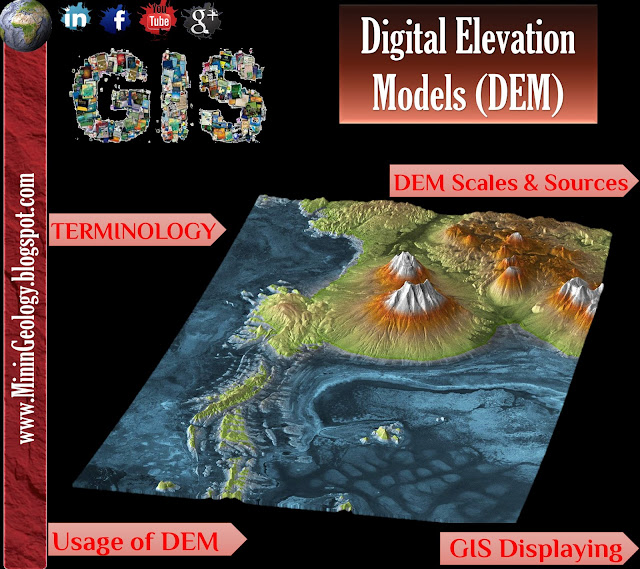
Digital Elevation Models (DEM)

01 Digital Elevation Models (DEM)
Digital Elevation Models (DEM)


INTRODUCTION
A DEM is a raster representation of the Altitude provide basic, quantitative information about the Earth’s surface. The accuracy of this data is determined primarily by the resolution (the distance between sample points). Other factors affecting accuracy are data type (integer or floating point) and the actual sampling of the surface when creating the original DEM.

Most data providers and professional users use the term DEM for both the digital terrain model (DTM) and digital surface model (DSM). A DTM usually refers to the physical surface of the Earth (elevations of the bare ground surface) without objects such as vegetation or buildings, while a DSM describes the upper surface of the landscape, includes the height of vegetation, man-made structures and other surface features, and only gives elevations of the terrain in areas where there is little or no ground cover (Maune, 2007). 

Elevation data sets, from which DEMs are generated, are obtained by a broad range of measurement techniques, such as ground survey (GPS, total station, terrestrial, and laser scanner), airborne photogrammetric imagery, airborne laser scanning (LiDAR), radar altimetry and interferometric synthetic aperture radar (InSAR).

TERMINOLOGY
Digital Elevation Model (DEM): generic term for altitude grid.
Digital Terrain Model (DTM): ground elevation model.
Digital Surface Model (DSM): ground + cover elevation model.
Digital Height Model (DHM): cover elevation model.
DEM Types

The digital elevation model corresponds to a regular grid of elevation. Each node of the grid shows an altitude value.
The resolution of the grid corresponds to the distance between to neighbor nodes.

DEM Scales Vs Sources


Global Scale
The GTOPO30 DEM was created based on heterogeneous topographical maps. The quality of the elevation data varies consequently over space.
The SRTM30 DEM was acquired through space shuttle radar interferometry. This new source of elevation data overcome the major quality problems of the GTOPO30.
They both present a resolution of 30 arc seconds (~900 m) and are freely available for the Earth surface.

Regional Scale
SRTM 90 Vs 30 DEM.The SRTM 90 & 30 m DEM were acquired through space shuttle radar interferometry.
They present a resolution of 3 arc seconds (~90 m) respectively 1 arc seconds (~30 m) and are available for the Earth surface.
The SRTM 90 m is freely available. The SRTM 30 m costs being of 0.5 $ per square kilometer. 

Local Scale (LASER DEM)
LASER DEMThis new acquisition technology allows the capture of very high resolution DEM (~1 m). Both terrain (ground) and surface (objects) are captured in the same time. Such detailed digital elevation model offers good potential for local relief analysis in applications such as hydrology, hazard mapping. The cost of acquisition are relatively high (150-300$ per square kilometer).

(LASER DEM)

The ASTER GDEM is provided at a one arc-second resolution (approximately 30m). The absolute vertical accuracy of ASTER GDEM is 20 m at 95% confidence level.
(ASTER GDEM2) was introduced to improve the spatial resolution, and increase the accuracy of water body coverage.
The Global Multi-resolution Terrain Elevation Data 2010 (GMTED2010) was generated at three separate resolutions of 30 arc-seconds, 15 arc-seconds, and 7.5 arc-seconds (approximately 1 km, 500 m and 250 m, respectively).

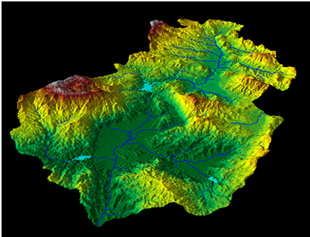
Examples of the topography detail displayed by the selected digital elevation models.

Usage of DEM
(1) Hydrological modelling including flood simulation, delineation and analysis of watersheds and drainage networks,
(2) Soil erosion and sediment transport modelling,
(3) Delineation and study of physiographic units,
(4) Soil and ecological studies,
(5) Geomorphological evaluation of landforms,
(6) Civil engineering and military applications such as site and route selection, landslide hazard assessment, visibility analysis (viewshed analysis), and
(7) Remotely sensed image enhancement for 3D analysis. Groundwater and climatic models also use digital topographic data as essential components. Digital elevation models provide an opportunity to characterize quantitatively land surface in terms of slope gradient and curvature and yield digital terrain information not blurred by land cover features which is often a problem in stereo-aerial photograph interpretation and remotely sensed image analysis.


Displaying Digital Elevation Model (DEM)/ (DTM)

Displaying Digital Elevation Model (DEM)-(DTM).

Analyzing Surfaces Terrain / DEM analysis tools
Some of these tools are primarily designed for the analysis of raster terrain surfaces. These include Slope, Aspect, Hillshade, and Curvature tools.

1.      Calculating Slope
It affects where structures or trails can be built, crops can be planted or harvested, the speed of flowing water and consequent erosion, landslide potential, and the list just goes on and on.
The Slope tool calculates the maximum rate of change from a cell to its neighbors, which is typically used to indicate the steepness of terrain. (0-90) degree.

Slope Calculation

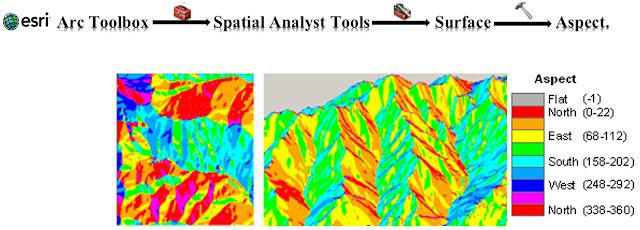
  2.  Calculating Aspect
Aspect identifies the slope direction in compass degrees from 0 (due north) to 360.
The aspect of a surface typically affects the amount of sunlight it receives (as does the slope); in northern latitudes places with a southerly aspect tends to be warmer and drier than places that have a northerly aspect. Aspect is an important contributor to vegetation and habitat type, as north-facing slopes often have very different conditions and temperatures than south-facing slopes.

Aspect Calculation

     3.  Hillshade
Hillshade allows us to determine the illumination of a surface (the DEM in the case) given a direction and angle of a light source (i.e. the sun). The resultant grid contains values ranging from 0-255 with 0 representing complete darkness.
Hillshading is an extremely useful way to depict the topographic relief of a landscape. Few methods are as intuitive and easy to understand as a hillshade. A good hillshade lets you understand immediately what areas are ravines, ridges, peaks or valleys.

Hillshade Calculation.

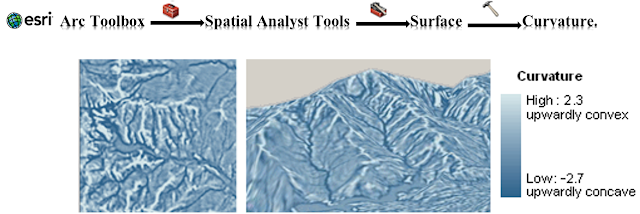
     4.  Curvature
Calculates the slope of the slope (the second derivative of the surface), that is, whether a given part of a surface is convex or concave. Convex parts of surfaces, like ridges, are generally exposed and drain to other areas. Concave parts of surfaces, like channels, are generally more sheltered and accept drainage from other areas. The Curvature tool has a couple of optional variants, Plan and Profile Curvature. These are used primarily to interpret the effect of terrain on water flow and erosion. The profile curvature affects the acceleration and deceleration of flow, which influence erosion and deposition. The planiform curvature influences convergence and divergence of flow.

Curvature Calculation.

Note
From an applied viewpoint, the output of the Curvature tool can be used to describe the physical characteristics of a drainage basin in an effort to understand erosion and runoff processes. The slope affects the overall rate of movement down-slope. Aspect defines the direction of flow. The profile curvature affects the acceleration and deceleration of flow and, therefore, influences erosion and deposition. The plan form curvature influences convergence and divergence of flow.
Displaying contours over a raster may help with understanding and interpreting the data resulting from the execution of the Curvature tool. An example of the process follows >>
1.       Use Contour to create contours of the raster.
2.      Create a slope raster.
3.      Contours of the slope.
4.      Add the curvature raster as a layer in ArcMap. Overlay the two contour coverage just created, and apply different color symbology for each.
Sources 
A book of "DTM Principles and Methodology"
Arc GIS online Courses 
Share:
Blog Directory & Business Pages - OnToplist.com
K.Amen. Powered by Blogger.
Subscribe Via Email

Sign up for our newsletter, and well send you news and tutorials on web design, coding, business, and more! You'll also receive these great gifts:

Science Blog Directory