Wednesday, December 21, 2016

Landsat 8 Oli Processing

Subset of your image that only includes the areas our are interested in. This saves disk space and processing time. Some software packages refer to this process as subsetting while others use the term clipping. Most raster data can be subset using XY coordinates, vector files or user created Regions of Interest (ROI). This process always creates a new dataset that only contains your data subset.
Image Subset
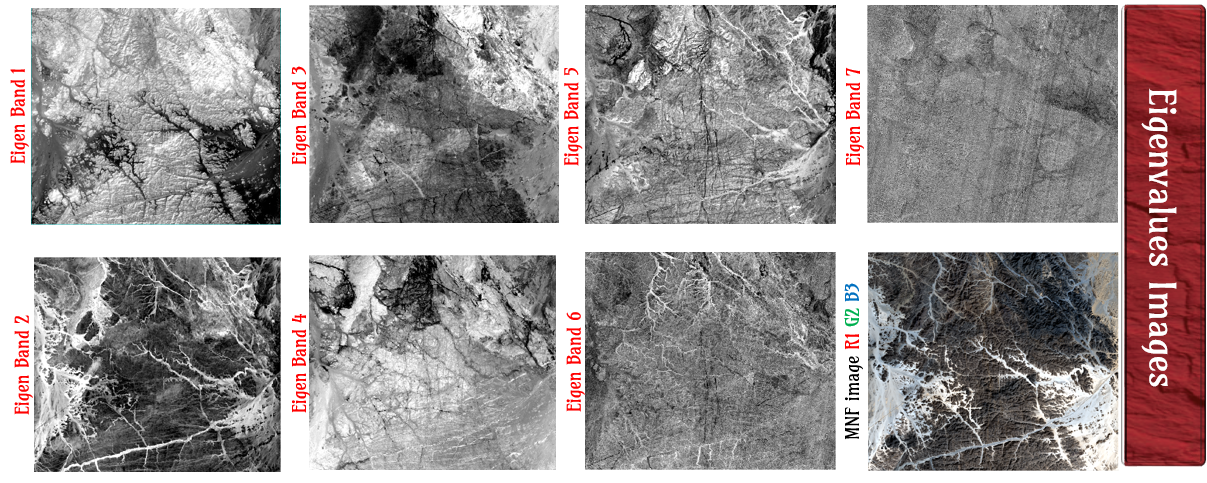
Minimum noise fraction (MNF) transformation is used to show the variation between bands in an image. This is a statistical method which works out differences in an image based on pixel DNs in various bands. MNF determines the inherent dimensionality of image data, to segregate noise in the data, and to reduce the computational requirements for subsequent processing. This step is often completed as a precursor to other types of analysis. Basically it is a way of simplifying the data. The MNF transform is essentially two principal component transformations. The first transformation, based on an estimated noise covariance matrix, decorrelates and rescales the noise in the data. [2]
This first step results in transformed data in which the noise has unit variance and no band-to-band correlations. The second step is a standard principal components transformation which creates several new bands containing the majority of the information. By using only the coherent portions, the noise is separated from the data, thus improving spectral processing results. Once applying MNF technique, on the 7 bands images TM (After being calibrated in reflectance mode), we will have like result 7 new bands images MNF. The image pixels are presented by eigenvalues. In examining the eigenvalues it can be seen that the first MNF bands ( 1 and 2) have the highest values while the remaining bands have consistent low values. It is the first two bands with the large values that contain most of the information and it is these bands that correspond to MNF images. The remaining low value bands (3 and under for example) are seen as noise. The images show the information compressed into only a few bands. The redundancy of the data is eliminated and noise is also removed. The result are more interpretable images. You could say that the data has been simplified or the dimensionality has been reduced. 
Eigenvalues Images
Optimum Index Factor (OIF) is a statistic value that can be used to select the optimum combination of three bands in a satellite image with which you want to create a color composite. The optimum combination of bands out of all possible 3-band combinations is the one with the highest amount of 'information' (= highest sum of standard deviations), with the least amount of duplication (lowest correlation among band pairs). The limitation of the OIF calculation is that, the best combination for conveying the overall information in a large scene may not be the best combination for conveying the specific information desired by the image analysis. This from experience in most cases is reasonable and that also depends on the type of study. The aim of this study is to use OIF technique to rank all the possible three-band combinations with the best favorable for geological mapping of El-Beda Prospect. [3] Based on the results obtained from OIF, the combination 7, 2 and 1 shows the highest value of OIF with the first rank. This band combination has the most information with the least amount of duplication so that the boundaries between rock units and other geological features are very clear.
Optimum Index Factor (OIF)
[2] J.W. , Boardman & F.A. , Kruse ; Thematic Coference on Geologic Remote Sensing, Environmetal Research Institute of Michigan, Ann Arbor, MI, I: 407-418; (1994); "Automated spectral analysis: A geologic example using AVIRIS data, noth Grapevine Mountais, Nevada".
[3] Ali M. Qaid and H.T. Basavarajappa ; American-Eurasian Journal of Scientific Research 3 (1): 84-91, 2008 ISSN 1818-6785"Application of Optimum Index Factor Technique to Landsat-7 Data for Geological Mapping of North East of Hajjah, Yemen".
Share:

Tuesday, December 20, 2016

Landsat 8 Preprocessing

Landsat 8 Preprocessing

Pre-processing of Landsat-8 OLI/TIRS data stage consists of those operations that prepare data for subsequent analysis that attempts to correct or compensate for systematic errors. The digital images are subjected to several corrections such as radiometric and atmospheric. Landsat-8 data were converted to surface reflectance by top-of-atmosphere (TOA) method Using Envi, which is recommended for calibration in mineralogical mapping, as it does not require prior Knowledge of samples collected in the field. Thermal atmospheric correction was performed on TIR bands with a normalized pixel regression method [1]. The 90-m resolution TIR bands were re-sampled to correspond to 30-m spatial dimensions for some image processing applications. Nearest neighbor re-sampling Was used to preserve the original pixel values in the re-sampled images.
Radiometric correction is done to reduce or correct errors in the digital numbers of images. The process improves the interpretability and quality of remote sensed data. Radiometric calibration and correction are particularly important when comparing data sets over a multiple time periods. The energy that sensors onboard aircrafts or satellites record can differ from the actual energy emitted or reflected from a surface on the ground. This is due to the sun's azimuth and elevation and atmospheric conditions that can influence the observed energy. Therefore, in order to obtain the real ground irradiance or reflectance, radiometric errors must be corrected for. The value recorded for a given pixel includes not only the reflected or emitted radiation from the surface, but also the radiation scattered and emitted by the atmosphere. In most cases were are interested in the actual surface values. To achieve these values radiometric calibration and correction must be applied.
Calibrated A sensor records the intensity of the electromagnetic radiation for each pixel as a digital number (DN). These digital numbers can be converted to more meaningful real world units like radiance, reflectance or brightness temperature. Sensor specific information is needed to carry out this calibration. In the case of Landsat data, the metadata file contains this information. Most image processing software packages have radiometric calibration tools. In ENVI some Landsat data can be converted directly to reflectance, with out needing to first calculate radiance. The Radiometric calibration has been done by Envi.
Atmospheric correction is the process of removing the effects of the atmosphere to produce surface reflectance values. Atmospheric correction can significantly improve the interpretability and use of an image. Ideally this process requires knowledge of the atmospheric conditions and aerosol properties at the time the image was acquired. The data had been corrected by FLAASH Module in ENVI.
Radiometric calibration

Share:

Applied Mining Geology


►OVERVIEW:-☛
🚩☛ Presents a comprehensive summary of mining geology procedures from data collection, quality assurance to their utilization in resource/reserve models, and implementation in mine production plans, which can be used as guidelines by mining industry specialists
🚩☛ Covers a good mix of theory and practice of interest to a wide range of specialists, students, lecturers, researchers and experienced geologists
🚩☛ Includes numerous case studies containing rich resources of unpublished data which can be used as a reference by specialists optimizing the mining geology procedures
🚩☛ Provides computer scripts attached as Electronic Supplementary Material to facilitate learning and utilization
📝 CONTENTS:-☛
☛Introduction
☛Mining Methods
☛Mine Mapping
☛Drilling Techniques and Drill Holes Logging
☛Sampling of the Mine Workings
☛Geotechnical Logging and Mapping
☛Dry Bulk Density (DBD) of Rocks
☛Data Points Location (Surveying)
☛Introduction to the Theory of Sampling
☛Quality Control and Assurance (QAQC)
☛Twin Hole
☛Database
☛Data Preparation
☛Geological Constraints of Mineralisation
☛Exploratory Data Analysis
☛Resource Estimation Methods
☛Introduction to Geostatistics
☛Variography
☛Methods of the Linear Geostatistics (Kriging)
☛Multivariate Geostatistics
☛Multiple Indicator Kriging
☛Estimation of the Recoverable Resources
☛Model Review and Validation
☛Reconciliation with New Data
☛Grade Uncertainty
☛Quantitative Geological Models
☛Principles of Classification
☛Methodology of the Mineral Resource Classification
☛Conversion Resources to Reserves
☛Balance Between Quantity and Quality of Samples
☛Lode Gold Deposits
☛Uranium Deposits (In-Situ Leach Projects)
☛Iron-Oxide Deposits
☛Bauxite Deposits
☛Mineral Sands
 📥 DOWNLOAD LINK 📥 
👇👇👇👇👇👇👇👇👇👇👇👇👇👇👇👇

Share:

Sunday, December 18, 2016

Wednesday, December 9, 2015

Pearls


Pearls are the most valuable of all organic gemstones, and have been prized for 6000 years. Pearls chemical makeup varies by region and environmental factors, but the basic formula is CaCO3. Pearls form through irritants entering specific species of mollusks (oysters, clams, muscles, etc), while the irritant can be a grain of sand or a parasite, the process is the same for pearls. The irritant is coated in CaCO3(mother of pearl) to make it less irritating to the mollusk.


Share:

Saturday, December 5, 2015

3D Map Generator – GEO


Available for PC and MAC as Plugin for
Photoshop CC (from v 14.2)

The 3D Map Generator – GEO“ is especially created for illustrating complex geographical 3D maps. In opposite to the current „3D Map Generator 2“ the new „3D Map Generator – GEO“ can be used to create big 3D maps in smaller map scales. With a few clicks it is possible to generate isometric 3D maps in 3 different orientations with heights and depths in the terrain. As basic shapes there can be used text layers, vector shapes, Smart Objects or one of 52 vector country shapes. For designing the map there are different new tools, textures, effects, brushes and 37 icons and elements available. The generated 3D maps can be edited and redesigned for unlimited times. No layers will be flattened. Of course it is also possible to put own textures onto the surface and to use own brushes, effects, icons or other elements.


Share:

Wednesday, December 2, 2015

Argentina Mountains


Share:

Tuesday, December 1, 2015

Blog Directory & Business Pages - OnToplist.com
K.Amen. Powered by Blogger.
Subscribe Via Email

Sign up for our newsletter, and well send you news and tutorials on web design, coding, business, and more! You'll also receive these great gifts:

Science Blog Directory